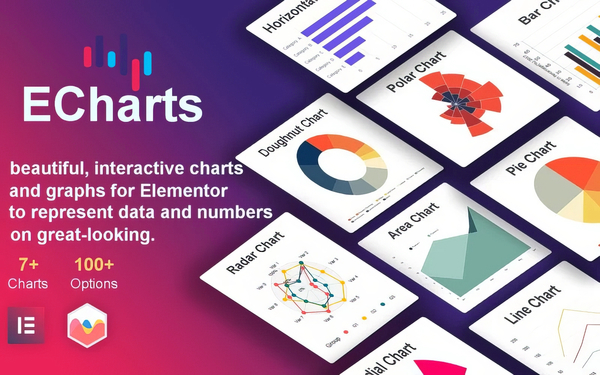
ECharts – Charts & Graphs WordPress Elementor Plugin
Ready to transform your data into something spectacular? Meet ECharts – the ultimate Charts & Graphs WordPress Elementor plugin that makes building interactive, stunning visuals a breeze. Say goodbye to boring spreadsheets and hello to eye-catching presentations!
Why ECharts is a Game Changer
In a world overflowing with data, how you present it matters. Whether you’re showcasing sales stats or user engagement metrics, ECharts helps you convey information clearly and attractively. So, why should you care?
- Better User Experience: Interactive graphs let visitors dive deeper into your data.
- Increased Engagement: Can a pretty chart keep your audience hooked? Absolutely!
- Professional Look: Create visuals that seamlessly match your brand.
Key Features of ECharts
What sets ECharts apart? Here’s the scoop:
- Diverse Chart Options: From bar graphs to pie charts, choose what suits your needs.
- Interactive Elements: Let your audience play with the data – it’s like a game, but for numbers!
- Super Easy to Use: Drag, drop, and design – no tech skills required.
- No Coding Skills Needed: Seriously, no coding, just pure creativity.
Want to elevate your website? You can download ECharts today and start crafting your data stories. It’s time to make your numbers shine!


Reviews
There are no reviews yet.