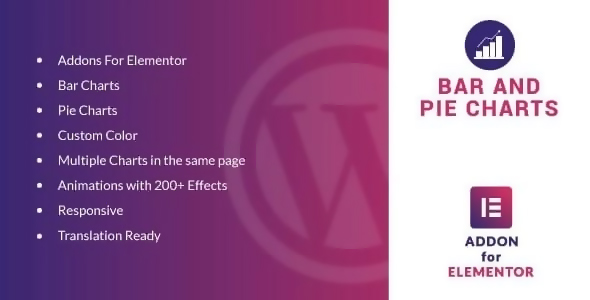
Bar and Pie Charts for Elementor
Want to take your data presentation to the next level? Meet the Bar and Pie Charts for Elementor plugin – your new best friend for creating stunning charts right within the Elementor page builder. Say goodbye to boring stats and hello to dynamic visual storytelling!
Why You Need This Plugin
Data visualization can be a game changer. Whether you’re sharing sales figures or survey results, the right charts can make complex information easy to digest. With this plugin, you can effortlessly integrate eye-catching bar and pie charts into your website. It’s like adding a cherry on top of your data sundae!
Features That Rock
- Fully Customizable: Match your charts to your site’s vibe with flexible colors and styles.
- Add Multiple Charts: Showcase all your data in one place – no limits!
- 200+ Animation Effects: Make your charts pop with engaging animations that catch the eye.
- Responsive Design: Your charts will look fab on any device. Mobile users? No problem!
- Translation Ready: Go global! This plugin is equipped for easy translation and localization.
Ready to give your data a makeover? Dive into the world of dynamic visualizations with the Bar and Pie Charts for Elementor plugin. Download the GPL version today and unlock advanced features to elevate your Elementor site. Your data deserves it!


Reviews
There are no reviews yet.